GeneticPedigreeChartToPed — Digitizing Family Trees for Hereditary Cancer Risk
Clinicians assessing hereditary cancer risk rely on pedigree charts — hand-drawn or digitized family trees encoding relationships, sex, and disease history across generations. These charts are the direct input to risk-assessment tools such as CanRisk, but turning a scanned or photographed pedigree into structured, machine-readable data is still largely a manual task.
This project — built for the data challenge “Towards connected healthcare: the implications of Artificial Intelligence” (Campus 5, Caen), in collaboration with the Centre François Baclesse, with A. F. Orou-Guidou and I. Jajour, under the supervision of L. Castera, C. Aucouturier, and A. Corroyer-Dulmont — designs an automated pipeline to close that gap.
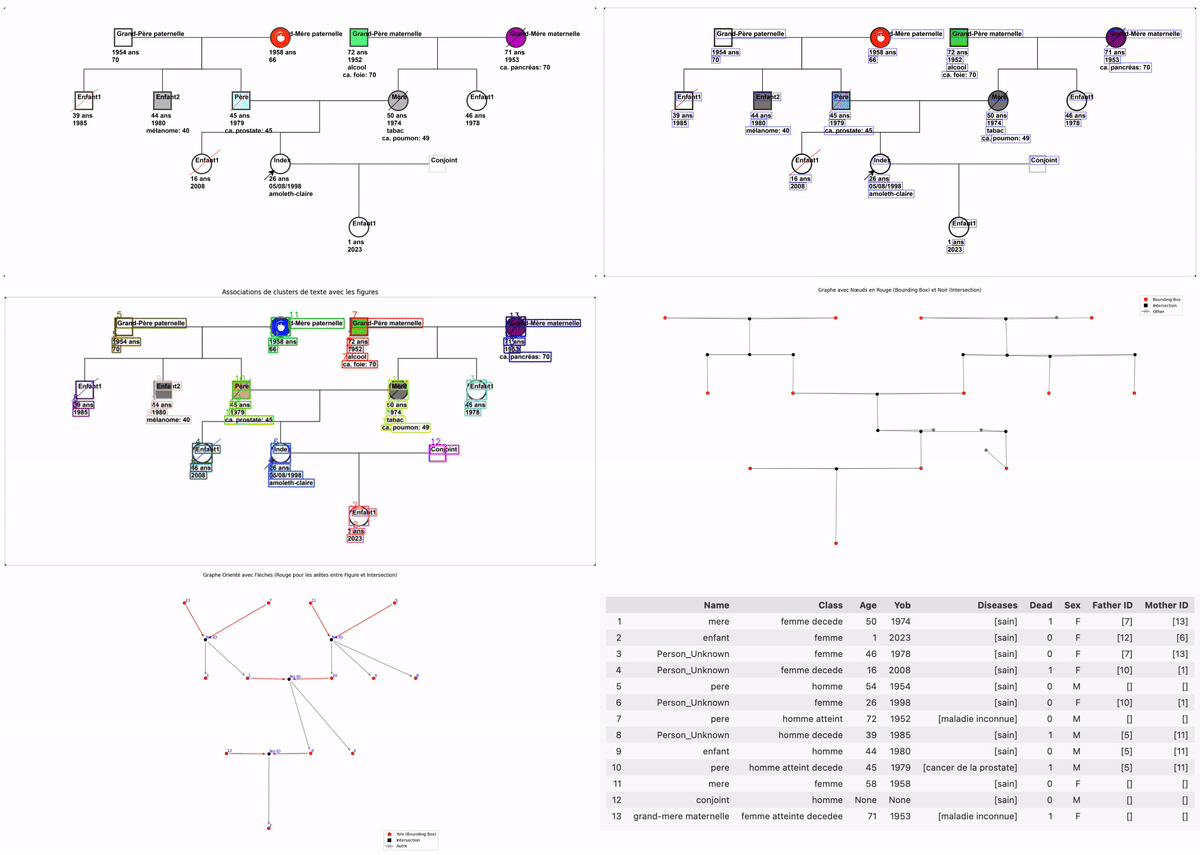
Pipeline
Six models chained together to go from a raw image to structured, CanRisk-compatible tabular data:
- YOLO — detects individual symbols (people) on the chart.
- EasyOCR — extracts handwritten/printed text (names, ages, notes) near each symbol.
- Text association & classification models — link extracted text to the correct individual and classify it (age, diagnosis, status, etc.).
- DeepLSD — detects the line segments that encode family relationships (parent-child, marriage, twins).
- Hierarchical graph analysis — reconstructs the full family structure from the detected individuals and connecting lines.

Why it’s hard
Pedigree charts have no fixed layout — they’re drawn freehand, at varying quality, with inconsistent symbol conventions from one clinician to the next. Getting individual detection, text-to-person association, and relationship-line parsing to work together reliably (rather than as three independently-tuned models) was the core engineering challenge, on top of eventually mapping the reconstructed graph into the tabular schema that downstream tools like CanRisk expect.
Stack: Python, YOLO, EasyOCR, DeepLSD, graph analysis. Code: github.com/VendenIX/GeneticPedigreeChartToPedAI
Enjoy Reading This Article?
Here are some more articles you might like to read next: